convisopro
convisopro
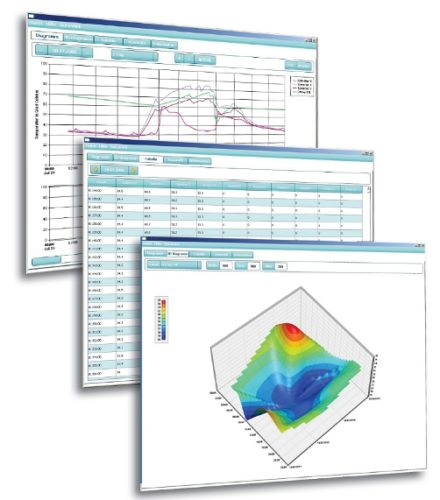
With the evaluation software convisopro you can display and evaluate logging data of controllers of the Prozeda controller family. All data can be displayed in graphical form (2D and 3D display) and in tabular form. All inputs, outputs and energy yields you want to display can be chosen comfortably. The graphical data are displayed for one day each and can be zoomed in and out freely. For free: PRO User of our conexioportal get free access to the convisopro softwareGeneral Details
- Graphical evaluation of all measurement data with curve charts
- Individually fading in and out of measurement data
- Zooming in and out, minutes-, hours-, daily-, monthly- and yearly view
- Displaying of data logging data of controllers of the Prozeda controller family
- Displaying of up to 27 sensor inputs
- Displaying of up to 12 outputs
- Displaying of energy yields
- Hard copy print
- .pdf print
- Displaying in tabular form (Excel export)
- Graphical display 2D
- Graphical display 3D
Downloads