conviso
conviso
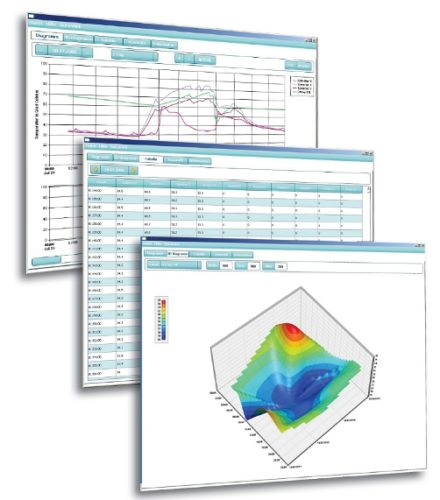
With the evaluation software conviso you can display and evaluate logging data of controllers of the Prozeda controller family. All data can be displayed in graphical form (2D and 3D display) and in tabular form. You can display two inputs and one output. The graphical data are displayed for one day each and can be zoomed in and out freely.The software is available for free at the tab "software" below.
General Details
- Graphical evaluation of all measurement data with curve charts
- Individually fading in and out of measurement data
- Zooming in and out, minutes-, hours-, daily-, monthly- and yearly view
- Displaying of data logging data of controllers of the Prozeda controller family
- Displaying of 2 sensor inputs
- Displaying of 1 output
- Hard copy print
- .pdf print
- Drucken als .pdf
- Displaying in tabular form (Excel export)
- Graphical display 2D
- Graphical display 3D
Downloads
Software